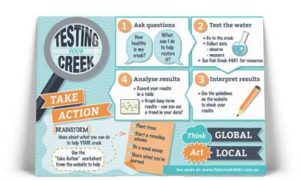
Testing your creek
Teacher information
Below is a step by step method of analysing the health of your local creek. If you are part of a school group, you may want to use the Investigation Booklet which is linked to the Year 5 HASS: Geography Curriculum.
For the unit plan, assessments and lesson resources, please visit the For Teachers page or contact Ollie on the Fish Creek 4061 Contact Us page.

Step 1: Ask the questions
- How healthy is your creek?
- What could you do to help restore the local creek …… and therefore Moreton Bay.

Step 2: Test the waterway
Go down to your local creek to collect both observational and measurable data. Use the Water Quality Data Collection Sheet to record the information. You will need a clipboard, pencil and water quality testing equipment to undertake the testing. If you don’t have access to water quality testing equipment, you can visit the Water Quality Resources page to access data already collected or contacts to get testing done by experts.
Questions you might want to consider before you start:
- How often are you collecting the data?
- How many sites are you looking at?
- Where can I collect the water safely?

Step 3: Interpret the results
Use the Guidelines for Water Quality Testing table to analyse your results. For each indicator, tick or highlight your result (or use the Results Analysis Table to represent your information in a table format). Identify which areas your creek could improve on and using the Results Analysis Table, interpret what it means and how you can ‘take action’.

(Optional) Step 4: Analyse the test results for long term data
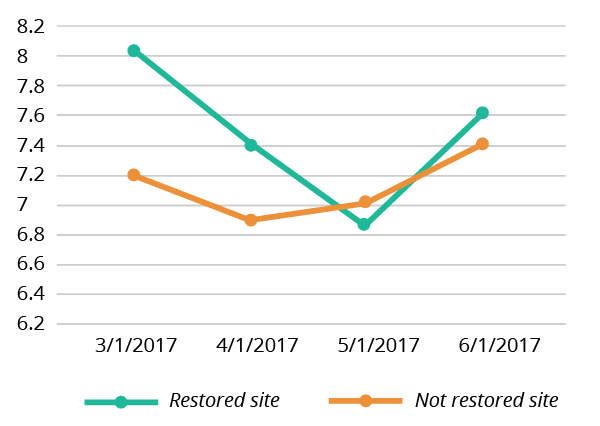
Record your results in a table format like the one below. If you are taking results over a longer period of time, graph the results to get an idea of what is happening to your creek over time (see example below).
| Indicator | 19/3/2017 Site 1 | 19/3/2017 Site 2 | 19/4/2017 Site 1 | 19/4/2017 Site 2 | 19/5/2017 Site 1 | 19/5/2017 Site 2 |
|---|---|---|---|---|---|---|
| Water Temperature (°C) | 22.4 | 23.2 | 20.2 | 21.1 | 18.6 | 17.9 |
| pH | 8.06 | 7.16 | 7.4 | 6.94 | 6.9 | 6.98 |
| Conductivity (μS/cm) | 1300 | 1570 | 451 | 383 | 661 | 1350 |
| Dissolved O2 (mg/L) | 7.4 | 5.3 | 2.9 | 3.2 | 2.6 | 5.1 |
| Turbidity (NTU) | 2.2 | 1.8 | 2.2 | 2.2 | 1.2 | 2.6 |
| Algae % | 10% | 10% | 10% | 10% | 10% | 10% |
| Colour | clear | clear | murky | murky | clear | clear |
| Foaming | none | none | low | none | none | none |
| Odour | nil | nil | nil | nil | nil | nil |
| Visible pollutants | little | medium | little | medium | medium | medium |
| Lab results | ||||||
| Ammonia N | 0.014 | <0.004 | <0.004 | 0.025 | 0.022 | <0.004 |
| Total Nitrogen (N) | 0.78 | 0.8 | 0.61 | 0.73 | 0.098 | 0.51 |
| Total Phosphorus (P) | 0.075 | 0.061 | 0.16 | 0.2 | 0.098 | 0.047 |
pH fluctuations at Fish Creek in 2017

An example of a data graph

Step 5: Take Action
Having analysed your results, brainstorm ideas about what you can do to ‘take action’ that will help your local creek. You can use the Take Action worksheet to give you some ideas. Visit the Water Quality Resources page for organisations that may help too.


